Q1 Cascade in network
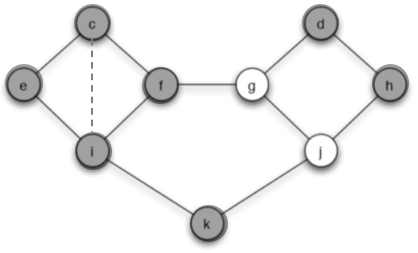
In the following social network, each node starts with behavior B, and has a threshold of q = 2/5 for switching to behavior A.
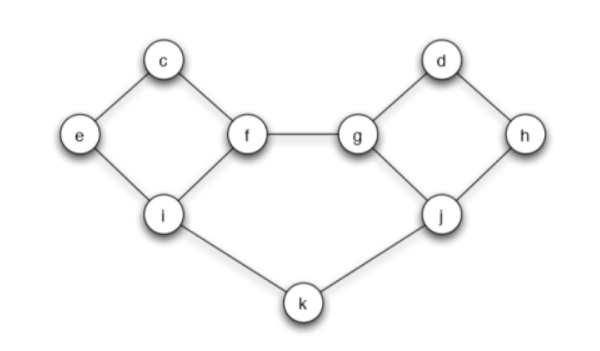
(a) Let the set of initial adopters of behavior A be S = {c, d}. Which nodes will eventually switch to A? Briefly explain your answer.
Answer: The node e and h will finally switch to A. Because with threshold of q = 2/5, and at the first step
so e and h will swich to A. However
and i, f, g, j will not swich to A. The spreading stops and only e and h switch to A.
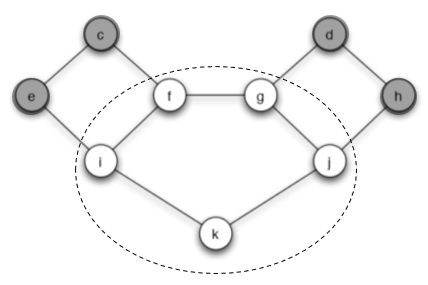
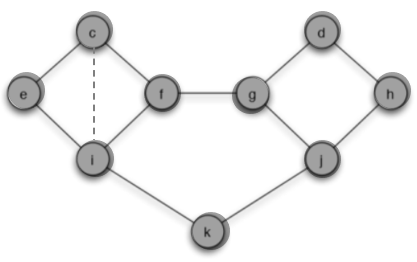
(b) Find a cluster of density greater than 1−q = 3/5 in the part of the graph outside S that blocks behavior A from spreading to all nodes (starting from S, at threshold q). Briefly explain your answer.
Answer: In the figure 2, I circle a cluster C with $density=\frac{2}{3}>\frac{3}{5}$
We consider the node f as an example. Node f connects with node c, i, g. And t = 2/3 fraction of its neighbors are in cluster C, r = 1/3 fraction not in C. If we want the cascade occur, r must be bigger than q which is equivalent to t smaller than (1-q). Now the density of cluster C is 2/3 which means all nodes in C have so the cascade is blocked.
(c) You are allowed to add a single edge to the network, connecting one of nodes c or d to any one node that it is not currently connected to. Can you do this in such a way that now behavior A, starting from S and spreading with a threshold of 2/5, would reach all nodes? Briefly explain your answer.
Answer: We can add an edge from c to i so the behavior A can spread to all nodes. This edge makes $p_i=2/4=1/2>q$ and make node i change its behavior to A.
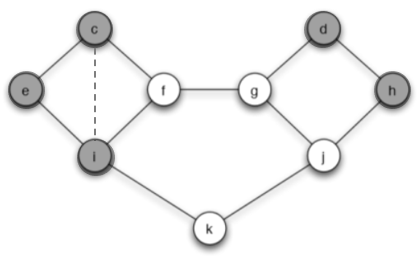
At the next step, $p_f=2/3>q$ and $p_k=1/2>q$ so node f and k will switch to A.
Then $p_f=p_j=2/3>q$ so node g and j switch to A. Finally all nodes change behavior to A.
Also we can add an edge between node d and j.
Q2 Decision-based diffusion model
Recall that in the decision-based diffusion model,
- if nodes v and w both adopt behavior A, they each get a payoff of a > 0;
- if they both adopt B, they each get a payoff of b > 0;
- if they adopt opposite behaviors, they each get a payoff of 0.
The total payoff for any one node is determined by adding up the payoffs it gets from each neighbor. Let’s now consider a slightly more general version of the model, in which the payoff for choosing opposite behaviors is not 0, but some small positive number x. Specifically, we replace the third point above with:
- if they adopt opposite behaviors, they each get a payoff of x, where x is a positive number that is less than both a and b.
In this variant of the model, is each node’s decision still based on a threshold rule? Specifically, is it possible towrite down a formula for a threshold q, in terms of the three quantities a, b, and x, so that each node v will adopt behavior A if at least a q fraction of its neighbors are adopting A, and it will adopt B otherwise?
In your answer, either provide a formula for a threshold q in terms of a, b, and x; or else explain why in this more general model, a nodes decision can’t be expressed as a threshold in this way.
Answer: The answer is YES i.e a formula for a threshold q can be written in terms of a, b and x. Now I will show the calculation process.
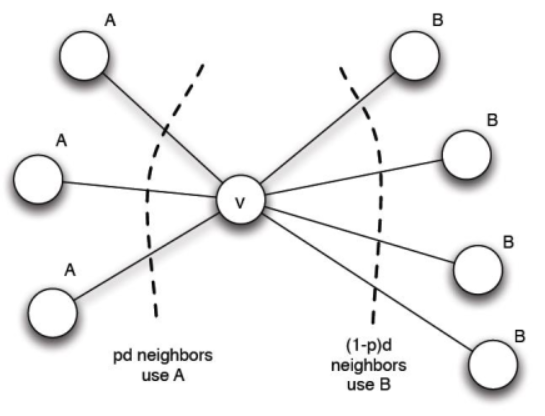
Let v have d neighbors and assume fraction p of v’s neighbors adopt A. Based on the variant of the model,
We compute,
Then we can get
Because x is a positive number less than a and b, then v chooses A if
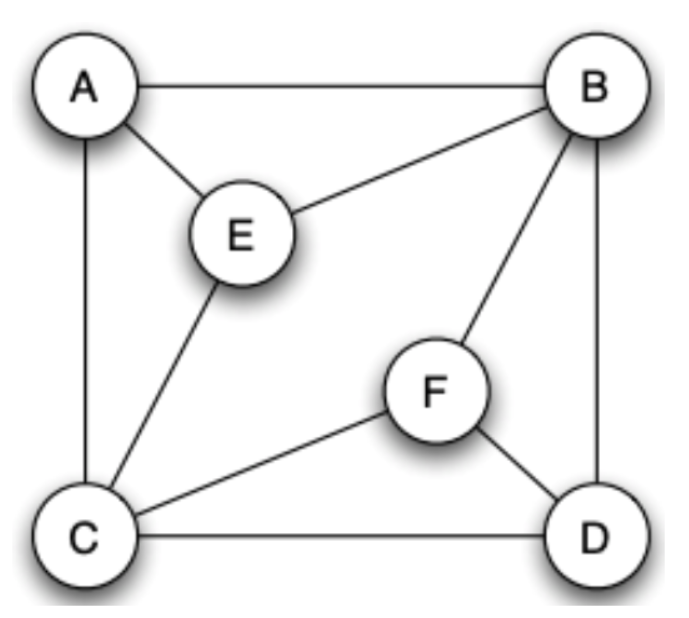
Q3 Girvan-Newman algorithm (GN algorithm)
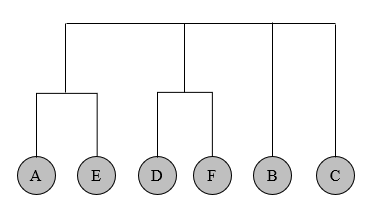
Given the following graph, show how to use the Girvan-Newman algorithm to obtain the whole dendrogram (you need to use the method shown in the lecture notes to compute the betweenness).
Step 1
Start from A and use symmetry to get the flows beginning with D
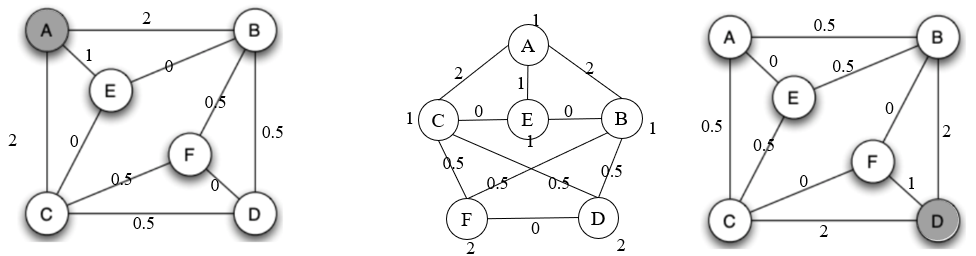
Start from B and C
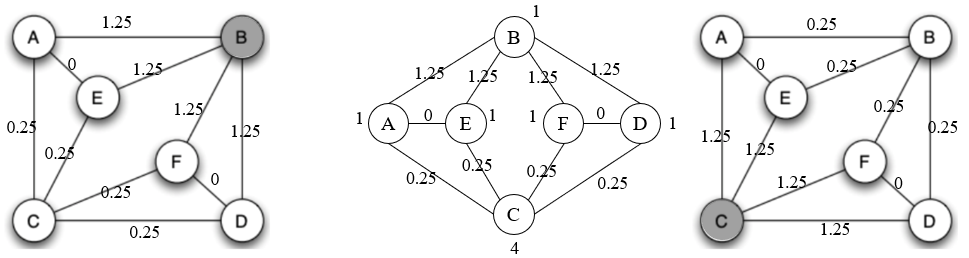
Start from E and F
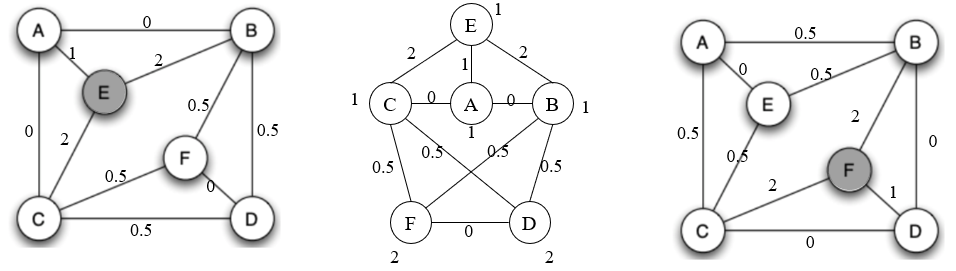
Step 2
Add up the flow values and divided everything by 2. Then we remove all the maximum edges and we only have AE and DF left. It’s obvious that we remove these two edges in the last step.
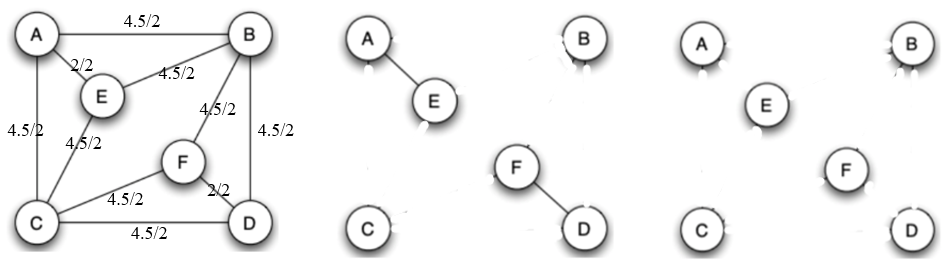
All edges have been removed.
Analyze each step of GN algorithm, we can obtain the dendrogram.
Q4 Cluster density
(a) What is the cluster density ($\rho$) of the circled cluster (1,2,3,4) in the following figure.
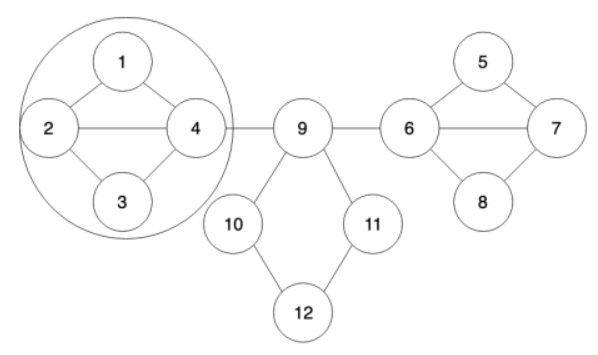
Calculate the density of the circled cluster
(b) What does this tell us about the difficulty of having a cascade?
Let S be an initial set of adopters of A and all nodes apply threshold q to decide whether to switch to A. It’s the fact that if G\S contains a cluster of $density \geq (1-q)$ then S cannot cause a cascade. Therefore, if we want to have a cascade, all subset of G\S must satisfy
Obviouly, consider the cluster in (a), Cluster P = {1,2,3,4} is a subset of G\S so its density must satisfy the condition
Therefore, we need to assume that the threshold q is lower than 1/4 for cascade happening which is a necessary and insufficient condition. This condition is hard to achieve which causes difficulty of having a cascade.
Q5 SIR model
Recall that the SIR model is defined by
where
- $S_t$ is the number of susceptible individuals in the population at time t;
- $I_t$ is the number of infected individuals in the population at time t;
- $R_t$ is the number of recovered individuals in the population at time t;
- $\beta$ is the probability that an infected neighbor attacks;
- $\gamma$ is the probability that an infected node heals.
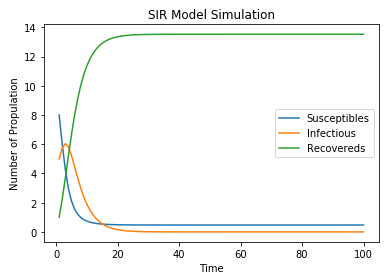
Let $S_0=10,I_0=4,R_0=0,\beta =0.05\text{and}\gamma =0.25$. Please write a program (in any language) to simulate this SIR model and show the plots of $S_t,I_t\,\,\text{and} R_t\,\,\text{for} t=1,2,\cdots ,100$.
I write the program with Python and the simulation result is shown in figure 14.
1 | # Import packages |